

Understanding air pollutants and air pollution effects on lichens:
A Pacific Northwest perspective
A Pacific Northwest perspective
Depositional Nitrogen
Nitrogen EmissionsNitrogen Deposition
Lichen Response to Nitrogen Deposition
Community responses
Climate interactions
Calculating lichen nitrogen response curves
How to Assess Air Quality Using Lichen Nitrogen Ratings
Method 1. Is nitrogen deposition elevated or not?
Method 2. Rank relative nitrogen deposition across a number of sites.
Method 3. How much N deposition is occurring?
Sulfur Dioxide
Sulfur Dioxide EmissionsSulfur Deposition
Lichen Response to Sulfur Containing Pollutants
How to Assess Air Quality Using Lichen SO2 Ratings
Ozone
Ozone Formation and Atmospheric Concentrations in the US Pacific NorthwestLichen Response to Ozone
Acidic Deposition
Formation and Deposition of Acidic PollutantsLichen Response to Acid Deposition
Fluorine
Metals
General Comments Regarding Lichen Sensitivity to Air Pollution
Effects of Other Environmental VariablesSelecting Units of Measurement for Air Pollutants
References
All literature cited here can be found in our annotated bibliographyAbbreviations
Refer to the following table for abbreviations.Table 1. A handy key to abbreviations
| Molecular Formula | Pollutant |
| F | Fluorine gas |
| F- | Fluoride ion |
| Hg | Mercury |
| Pb | Lead |
| HNO3 | Nitric acid |
| NH3 | Ammonia gas |
| NH4+ | Ammonium ion |
| NOx | Nitrogen oxides |
| NO | Nitrogen monoxide |
| NO2 | Nitrogen dioxide |
| NO3- | Nitrate ion |
| O3 | Ozone |
| SO2 | Sulfur dioxide |
| H2SO4 | Sulfuric acid |
Depositional Nitrogen
Nitrogen emissions in Oregon and Washington
Nitrogen-containing emissions from fossil fuel combustion (NO and NO2) and agriculture (NH3) contribute the majority of N-containing pollutants to the atmosphere. The deposition of these pollutants and secondary pollutants derived from them (e.g. NH4+, NO3-, and HNO3), has the greatest potential to harm Pacific Northwest vegetation and aquatic ecosystems compared to other inorganic air pollutants. While industry is an important source of NOx, mobile and agricultural sources contribute the majority of emissions (see Table 2). Therefore, compared to sulfur dioxide, decreases of N-containing pollutants are harder to achieve because they are more directly tied to population size (amount of fossil fuel burned per person) and agricultural intensity.
Table 2. Summary of Oregon and Washington nitrogen emissions in 2002.
| Emissions Source | N-NH3(tons/y) | N-NOx(tons/y) | % of Total N Emissions |
| Fuel Combustion: Electric Utilities | 141 | 8,043 | 3 |
| Fuel Combustion: Industrial, Commercial, Institutional | 290 | 10,783 | 4 |
| Fuel Combustion: Residential | 0 | 3,670 | 1 |
| Industrial Processes 2,291 4,169 | 2,291 | 4,169 | 2 |
| Waste Disposal & Recycling | 141 | 1,312 | 0 |
| Highway Vehicles | 6,948 | 93,993 | 34 |
| Off-highway Vehicles & Aircraft | 52 | 21,982 | 7 |
| Marine Vessels | 14 | 29,001 | 10 |
| Railroads | 10 | 10,594 | 4 |
| Other Area Combustion Sources | 27,935 | 7,231 | 12 |
| Agriculture & Forestry | 68,322 | 805 | 23 |
| Total | 106,133 | 191,583 | 100 |
Source: National Emissions Inventory 2002 for Oregon and Washington, US EPA - AirData Emissions by Category Report - Criteria Air Pollutants, Monday, 20-Apr-2009 at 6:1:6 PM (USA Eastern time zone)http://www.epa.gov/airdata
Calculations: Emissions reported as NH3 and NOx have been converted to N from NH3 and to N from NOx based on proportion of the atomic weight of N to total molecular weight (N-NH3 = NH3 X 14/17; N-NOx = NOx * 14/46). Assumption: All NOX is NO2
Notes: Vehicles & other non-point combustion sources produce about 66% of the bi-state N emissions. Agriculture and (to a much lesser extent) forestry, contribute 23% of N emissions, mostly as NH3. Industrial & commercial point sources produce 10% of N emissions. Home heating produces only about 1% of N emissions
Nitrogen deposition in Oregon, Washington and Idaho
Porter (2006) simulated nitrogen deposition patterns in the Pacific Northwest using a numerical air quality modeling system consisting of the MM5 meteorological model and the Community Multi-scale Air Quality atmospheric chemistry and transport model (Fig 1.) Estimates of mean annual nitrogen deposition for the Pacific Northwest from 1990-1999 peaked at 5-13 kg N ha-1 y-1, centered around the Seattle and Portland metropolitan areas and intensively agricultural areas in the Willamette Valley, northeastern OR and the Columbia Basin; lowest deposition occurred at remote sites in the Coast Ranges, Cascade Ranges, and southeastern OR where many sites received 0.6-1.5 kg N ha-1 y-1 (Porter 2006).
Figure 1. 1990-1999 Mean annual total nitrogen deposition in Washington, Oregon and Idaho, USA (Porter 2006). Grid cell diameter: 36 km.
Lichen response to N deposition in the Pacific Northwest
Community responses
Lichens are very responsive to nitrogen, an essential nutrient for all living organisms. Epiphytic lichens obtain nitrogen from atmospheric sources; from ammonium, nitrate and nitric acid dissolved in rain, fog and snow, or canopy throughfall (leaf wash from higher branches) or from direct dry deposition of N-containing particulates or gases like ammonia, nitrogen oxides, or nitric acid vapor. Lichens that evolved under different nitrogen-availability regimes have different N requirements and tolerances. Most montane species are adapted to low available nitrogen in high rainfall, leached, oligotrophic environments on acidic substrates like conifer branches. In contrast, valley species are adapted to more moderate or mesotrophic environments, and often occur on hardwoods. These less acidic substrate pHs and lower rainfall enhance availability of nutrients like nitrogen, phosphorus and calcium. Eutrophic species evolved in very high nutrient environments such as small animal perches, rocks under bird nests and seashore environments. Adding nitrogen to the environment tends to shift lichen community composition dominance from oligotrophic to eutrophic species. Although there may be no net loss in biodiversity due to excess nitrogen in the environment, adverse effects may result as integral ecological roles played by oligotrophic lichens as winter forage, nesting materials, insect habitat, as well as in nitrogen fixation, moderation of humidity and nutrient cycling, are lost due to their substitution by eutrophic species.
Temperature and precipitation interactions
Climate can be expected to affect nitrogen sensitivity. For example, lichens that are typically found within a moderate temperature zone, may be found in a colder one (i.e. more stressful) if extra nutrient nitrogen is available. Because nitrogen is best absorbed when a lichen is wet, lichens are more responsive to the concentrations (mg/l) dissolved in the water with which they are wetted, than to total deposition or loading (kg N ha-1 y-1). Therefore a given lichen is likely to tolerate deposition greater than that at the peak detection frequency in high precipitation areas, and a lower loading in low precipitation areas.
Calculating lichen nitrogen response curves
An empirical nitrogen rating for each species has been calculated from the response curve generated by plotting nitrogen deposition vs. detection frequency across regional nitrogen gradients in western Oregon and Washington. Only epiphytic macrolichens (non-crustose lichens) have been rated. Response curves show the relationship between the frequency of detection of individual epiphytic macrolichens and the total average annual N deposition modeled by Porter (2006) using MM5/CMAQ for 1990-1999. Lichen detection coordinates were overlaid on the 36 km (cell width) output grid generated by the model and the grid cell values for N deposition were thus assigned to the corresponding coordinates for each location in the region where each lichen was found. The number of detections of each lichen in each of 8 deposition groups (0.5 to 1.5; 1.5 to 2.0; 2.0 to 2.5; 2.5 to 3.0; 3.0 to 3.5; 3.5 to 4.0; 4.0 to 4.5; 4.5 to 8.1 kg N ha-1 y-1) was adjusted by dividing by the total number of plots in that deposition group, yielding a 'per plot' estimate of likeliness of detection within a deposition group. This was necessary because there were many more surveys in some deposition groups than others, which would increase the chance of finding a lichen in those deposition ranges. The adjusted data were plotted as detection group vs. % of all detections in that group. Then the best line through the data was drawn using a smoothing spline (lambda = 0.1). The value for deposition at the peak of each fitted curve (i.e. the point at which the greatest number of detections occurs) was used as the Deposition Peak for the lichen's N rating. Functional group was assigned to each species as follows:
Oligotroph: peaks by 2.4
Mesotroph: peaks between 2.5 and 4.5
Eutroph: peaks above 4.6
For specific examples click here
How to assess air quality using lichen N ratings
The following methods can be used to evaluate a single site or multiple sites across an air pollution gradient. For best results, each test site should be located in a natural forest or woodland (city parks are also OK, but look for a spot with at least 10-15 trees, preferably native species). Measure out a circular plot of approximately 35 m diameter, then search the plot for up to two hours, recording or collecting each epiphytic macrolichen you find (if using Method #1, search for indicator species only). Make a list of the species you encountered, then look up their nitrogen rating in the Air Pollution Sensitivity Ratings page of this website. Delete species that are not rated.
Method #1. Answers the question, 'Is nitrogen deposition elevated here or not?'
Look for the following indicator eutrophs: Candelaria concolor, Physcia adscendens, and Xanthoria polycarpa. The presence of these species, especially if any are present in abundance (e.g. many hundred individuals), is indicative of nitrogen deposition from either anthropogenic or natural sources; the greater the cover, the greater the availability of nitrogen. These species are fairly easy to recognize, but if you want to challenge yourself taxonomically, search for additional indicator eutrophs like Physcia aipolia, Physconia perisidiosa, Physconia enteroxantha, Physconia isidiigera, Xanthoria candelaria, or Xanthoria parietina. Note that not all eutrophs are good indicator species; Parmelia sulcata for example thrives in high N environments in the Pacific Northwest, but has such a broad habitat amplitude that it is also commonly found at clean sites. If none of these indicator species is present and the site is not a lichen desert (i.e. no lichens are present!) or subject to high levels of other pollutants such as fluorine, SO2, or acidic deposition; all of which would be detrimental to these eutrophic lichens; then there is little chance that nitrogen deposition is high enough to be of ecological concern. If a few individuals are present, but the site is also relatively dry and at low elevation, little concern is warranted either. But if many individuals and many indicator species are present, and the habitat is not naturally nutrient rich (Fig. 2), then their presence indicates that N deposition to the site is anthropogenically enhanced (Fig 3).
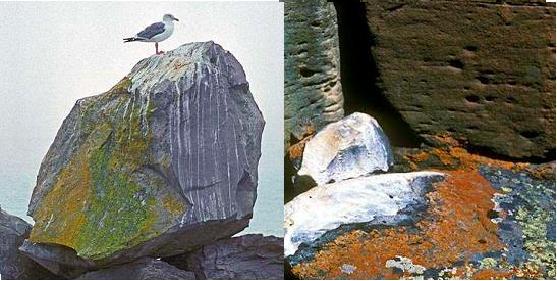
Fig. 2. Orange-colored eutrophic lichens thrive naturally beneath a bird perch along the coast (left) and a pack rat latrine in southern British Columbia (b). The nitrogen-rich droppings create excellent conditions for these native lichens. Photo credits: Stephen Sharnoff.
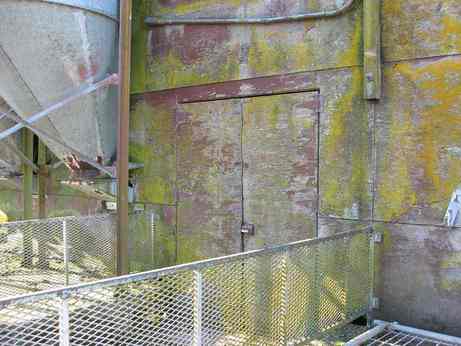
Fig. 3. Orange- and yellow-colored eutrophic lichens also thrive in agricultural settings yielding ammonia emissions. In this case, they add a bright color to the wooden siding of a hog-rearing barn at Oregon State University in Corvallis. Photo credit: Doug Glavich.
Method #2: Answers the question, 'Can I compare or rank relative nitrogen deposition across a number of sites?'
Detect shifts in lichen community composition across a nitrogen gradient by comparing proportions of oligotrophic: mesotrophic: eutrophic species across sites (Fig. 4, Table 3 ). Sites with higher proportions of eutrophs and fewer oligotrophs receive more nitrogen than sites with many oligotrophs and few eutrophs. Simply plot the percent of oligotrophs, mesotrophs, and eutrophs at each site (i.e. make three separate figures). To rank the sites, order them by increasing % eutrophs or decreasing % oligotrophs. To reduce variability due to natural bark pH differences, compare sites that are within the same general forest type (i.e. conifer vs. hardwood). Categorize a survey site with 20% or more of basal area or canopy cover in hardwoods as a hardwood forest type.
Figure 4. The relative likelihood of encountering oligotrophic lichens decreases with increasing nitrogen deposition, mesotrophs peak at moderate deposition, and eutrophs are most likely to be found where deposition is > 4.5 kg ha-1 y-1. For example, in western Oregon and Washington, 32.5% of all detections of oligotrophic lichens occurred in areas where total N deposition was < 1.5 kg ha-1 y-1 but only 4% of oligotroph detections occurred at sites where N deposition >4.5 kg ha-1 y-1. In contrast, 31% of eutroph detections occurred in areas where N deposition was > 4.5 kg ha-1 y-1but only 4% occurred in areas with <1.5 kg kg ha-1 y-1 deposition.
Table 3. As mean N deposition increases in western Oregon and Washington, the mean proportion of the epiphytic lichen community composed of eutrophs increases and the proportion comprised by oligotrophs and mesotrophs decreases.
| Total N Deposition(kg N ha-1 y-1) | % Oligotrophs | % Oligotrophs and Mesotrophs | % Eutrophs |
| 2.5 | 53 | 91 | 9 |
| 3.1 | 44 | 80 | 20 |
| 3.4 | 30 | 66 | 34 |
| 4.1 | 25 | 53 | 47 |
| 4.3 | 18 | 39 | 61 |
Method #3: Answers the question, 'How much N deposition is occurring here?'
Estimate N deposition by averaging the individual values for 'deposition at peak frequency' for all oligotrophs and eutrophs on the site (exclude mesotrophs). The accuracy of this method improves with number of survey sites but with just one site you will have about a 70% chance of being within 1 kg ha-1 y-1of the total N deposition value predicted by deposition modeling.
Sulfur dioxide
Sulfur dioxide emissions
Sulfur dioxide (SO2) has declined substantially in the Pacific Northwest states and elsewhere in the US since implementation of the federal Clean Air Act. Anthropogenic emissions of SO2 are largely industrial; currently the region's two coal-fired electric utilities are the largest remaining regional point sources. Marine vessels, which also burn high-sulfur fuels, emit about as much sulfur as the two power plants (Table 3). Emission controls on point sources have been very effective in reducing regional SO2 emissions.
Table 3. Summary of Oregon and Washington sulfur emissions in 2002.
| Emissions Source | S-SO2(tons/y) | % of Total S Emissions |
| Fuel Combustion: Electric Utilities | 15,892 | 22 |
| Fuel Combustion: Industrial, Commercial, Institutional | 13,514 | 19 |
| Fuel Combustion: Residential | 1,489 | 2 |
| Industrial Processes | 6,439 | 9 |
| Waste Disposal & Recycling | 469 | 1 |
| Highway Vehicles | 4,513 | 6 |
| Off-highway Vehicles & Aircraft | 4,113 | 6 |
| Marine Vessels | 14,847 | 21 |
| Railroads | 996 | 1 |
| Other Area Combustion Sources | 7,388 | 10 |
| Agriculture & Forestry | 1,080 | 2 |
| Total | 70,739 | 100 |
Source: National Emissions Inventory 2002 for Oregon and Washington, US EPA - AirData Emissions by Category Report - Criteria Air Pollutants. Monday, 20-Apr-2009 at 6:1:6 PM (USA Eastern time zone). http://www.epa.gov/airdata
Calculations: Emissions reported as SO2 have been converted to S from SO2 based on proportion of the atomic weight of S to the total molecular weight of SO2 ( S-SO2 = SO2 * 32/64).
Notes: Power generation by electric utilities, primarily from the region's 2 coal-fired power plants, produces 22% of regional sulfur emissions. Marine vessels contribute 21% of S (and also 10% of N, see Table 2) emissions. Other industrial & commercial point sources contribute 19%.
Sulfur deposition
Porter (2006) simulated sulfur deposition patterns in the PNW (Fig 5.) using a numerical air quality modeling system consisting of the MM5 meteorological model and the Community Multi-scale Air Quality atmospheric chemistry and transport model.
Figure 5. 1990-1999 Mean annual total sulfur deposition in Washington,
Oregon and Idaho, USA (Porter 2006). Grid cell diameter: 36 km.
Lichen response to S-containing pollutants
Although there are only a few places in the Pacific Northwest where ground level SO2 concentrations may still be high enough to harm lichens, lichen responses to sulfur dioxide are fairly well understood. This is because many surveys were completed in Europe and North America during the 1970s and 1980s, when SO2 was often the dominant air pollutant affecting lichens. Ratings presented here are based on this body of literature. Sulfur dioxide affects lichens by disrupting important physiological processes. It is easily absorbed by lichens and, dissolved in cellular cytoplasm, has an acidifying effect. Enzyme mediated physiological processes such as photosynthesis and respiration are very sensitive to pH and are impaired by added acidity. All lichens are thus sensitive to sulfur dioxide, although some are more sensitive than others. The net effect on lichen communities is always a decrease in diversity as sensitive species are lost but no new species replace them.
How to assess air quality using lichen SO2 ratings
Follow general instructions under 'how to assess air quality using lichen N ratings' above, except look up the SO2 rating for each species. The presence of sensitive species is a good indication that average annual SO2 levels are < 15 ppb. If only tolerant species are present, then average annual SO2 levels are probably >30 ppb. If you are sampling along a gradient, e.g. a transect from a point source, and no other air pollutants are changing with distance, then the proportions of sensitive and intermediate species should increase with distance from the source, as should the total number of species. A lichen desert can result from very high ambient SO2 concentrations. In such cases, tolerant species will be the first species encountered with distance from the source.
Ozone
Ozone formation and atmospheric concentrations in the US Pacific Northwest
Ozone is produced in the atmosphere in the presence of nitrogen oxides, volatile organic compounds and sunlight; hot, sunny days are especially conducive to its formation. Cool, wet climates and federally mandated NOx controls on point sources have helped to minimize its production in the PNW. However increasing population, if not matched with equivalent per capita NOx reductions, combined with warming climate could potentially counteract these advantages in the future.
Lichen response to ozone
So far there is no evidence that ozone is detrimentally affecting lichens in the Pacific Northwest. Lichens tend to be metabolically inactive and unresponsive during the hot, sunny conditions that are most conducive to ozone formation. Although fumigation studies have shown that lichen physiology is detrimentally affected by ozone, the most sensitive regional indicators of this pollutant will probably continue to be vascular plants. Ratings for ozone sensitivity of lichens presented here are highly tentative, largely reflecting the expert opinion of Rhoades and Ryan (1992). Their ratings, and those of others, are offered here as a starting point for further empirical or experimental studies.
Acidic deposition
Formation and deposition of acidic pollutants
In addition to being unhealthy to breathe and an important cause of visibility impairment, NOx and SO2 in the atmosphere form the secondary pollutants, nitric and sulfuric acids. Acidic deposition, simplistically called 'acid rain', occurs when these acids are deposited to the environment dissolved in rain, snow or fog, but also in particulate or vapor form. A myriad of harmful effects to the environment can ensue, some of the most well known being declines in aquatic species, including fish, and forest die-back. Still a widespread problem in the eastern US, acidic deposition is generally not a problem in the West, with exceptions in major urban areas, high fog areas downwind of major emissions sources, and ultra-sensitive high-elevation lakes.
Lichen response to acid deposition
Acidic deposition definitely affects lichens most species have well defined tolerance ranges for substrate pH, and physiological processes are also pH sensitive, as discussed under the 'Sulfur dioxide' section above. Whereas plants and animals have specialized tissues to shed precipitation and control absorption, lichens readily absorb precipitation of any pH and are thus more vulnerable to it. Ratings for acidity in the literature are sparse and therefore only a few species have been given sensitivity ratings here. One current impediment to field or empirical studies is that nutrient nitrogen deposition (from ammonia, ammonium and nitrates) is now also present in much of the US and Europe where deposition is acidified. That is, there are few places where the dominant pollutant is solely SO2 or acidity. In general, one might expect SO2 tolerant lichens to be tolerant of acidic deposition. Also lichens on conifers may be better adapted to lower pH substrates than lichens of hardwoods.
Fluorine
Lichens are extremely sensitive to fluorine gas, yet very few researchers have tried to quantify atmospheric concentrations of fluorine that harm lichens. Instead, sensitivity to fluorine has usually been defined by the amount of fluoride that lichen thalli accumulate before harm occurs. Fluoride ratings are thus relative, i.e. loss of sensitive species will occur before loss of intermediate or tolerant species. Ratings for fluorine are based on the wider literature, and are offered here as a potential starting point for studies around local emissions sources.
Metals
Lichens exhibit a range of tolerances to metals. Some species of Cladonia, Peltigera, and Stereocaulon can tolerate surprisingly high levels of metals, and may even be found growing on mining spoils or other metal-enriched substrates. Some species of Hypogymnia near nuclear accident or test sites can apparently tolerate impressive amounts of radiation (Biazrov 1993, 1994). Determination of metal concentrations in lichen thalli is the most commonly used approach to bioindication of metal pollution using lichens (Garty 2001). Some commonly measured metals include sulfur, mercury, lead, cadmium, chromium, zinc, and copper.
General comments regarding lichen sensitivity to air pollution
Effects of other environmental variables
Keep in mind that, like other organisms, lichens in nature respond to a variety of environmental influences (temperature and moisture regimes, nutritional status, habitat substrates and substrate continuity, canopy density, light, competition, as well as the changing mix of air pollutants). These influences can moderate or heighten sensitivity to any given air pollutant. Controlling for these variables makes it easier to detect an air pollution signal. Accounting for these variables can help to elucidate the natural response range; for example, given the same amount of air pollution, how does the position of the lichen in the forest interior or the edge, or low vs. high precipitation, or a climate in which the lichen is frozen much of the year affect lichen response?
Selecting units of measurement for air pollutants
Concentrations of pollutants can be experienced differently than total deposition Concentrations are mass per unit volume of a pollutant in air or precipitation. Deposition is the total loading or mass per unit area. Episodes of very high concentrations of pollutants (e.g. ozone or fluorine) can be quite damaging, even if average annual levels are relatively low. Similarly mean pollutant concentrations will decrease as precipitation increases under the same depositional load. Are lichens more responsive to mean concentrations of pollutants, episodes of maximum pollution concentrations, or total pollutant loading? When gauging lichen response, it is important to consider the most appropriate measurement unit.